

Litecoin (LTC) Price Prediction 2026, 2027-2030

- Bullish LTC price prediction for 2026 is $122.68 to $182.21.
- Litecoin (LTC) price might reach $200 soon.
- Bearish LTC price prediction for 2026 is $49.07.
In this Litecoin (LTC) price prediction 2026, 2027-2030, we will analyze the price patterns of LTC by using accurate trader-friendly technical analysis indicators and predict the future movement of the cryptocurrency.
|
TABLE OF CONTENTS
|
|
INTRODUCTION
|
|
|
LITECOIN (LTC) PRICE PREDICTION 2026
|
|
| LITECOIN (LTC) PRICE PREDICTION 2027, 2028-2030 |
| CONCLUSION |
| FAQ |
Litecoin (LTC) Current Market Status
| Current Price | $82.11 |
| 24 – Hour Price Change | 1.35% Up |
| 24 – Hour Trading Volume | $286.68M |
| Market Cap | $6.3B |
| Circulating Supply | 76.72M LTC |
| All – Time High | $412.96 (On May 10, 2021) |
| All – Time Low | $1.1137 (On Jan 15, 2015) |
What is Litecoin (LTC)
| TICKER | LTC |
| BLOCKCHAIN | Litecoin |
| CATEGORY | Peer-to-Peer Cryptocurrency |
| ORIGIN DATE | October 2011 |
| UTILITIES | Governance, security, gas fees & rewards |
Litecoin (LTC) is one of the pioneer cryptocurrencies that debuted in the crypto space after Bitcoin. LTC was launched in 2011 as Bitcoin-inspired crypto. Litecoin’s creator Charlie Lee calls it a “coin that is silver to Bitcoin’s gold”. Just like Bitcoin, the Litecoin blockchain also operates on the proof-of-work (PoW) consensus.
Bitcoin and Litecoin have key differences in their supply cap, hashing algorithm, and transaction speed. LTC has a fixed supply cap of 84 million which is greater than Bitcoin’s 21 million supply cap. Unlike Bitcoin’s SHA-26 hashing algorithm, Litecoin uses the Scrypt algorithm. It takes around 2.5 minutes for a block to be generated on the Litecoin blockchain whereas it would take 10 minutes on Bitcoin.
Litecoin 24H Technicals
 (Source: TradingView)
Litecoin (LTC) Price Prediction 2026
Litecoin (LTC) ranks 20th on CoinMarketCap in terms of its market capitalization. The overview of the Litecoin price prediction for 2026 is explained below with a daily time frame.
In the above chart, Litecoin (LTC) laid out an Ascending Triangle pattern. The ascending triangle is a characteristic pattern of an ongoing bullish trend. This triangle is formed by a horizontal upper trendline that connects the highs, indicating a consistent level of resistance, and a lower trendline that connects the rising lows, reflecting increasing buying pressure.
As the price approaches the apex of the triangle, the tension between buyers and sellers intensifies. If the trend breaks out at the resistance level, the price will continue to move up in this ascending triangle pattern, often leading to further gains. Traders typically look for confirmation of the breakout, which can enhance the likelihood of a successful upward move.
At the time of analysis, the price of Litecoin (LTC) was recorded at $82.11. If the pattern trend continues, then the price of LTC might reach the resistance levels of $85.01 and $99.19. If the trend reverses, then the price of LTC may fall to the support levels of $79.90 and $72.59.
Litecoin (LTC) Resistance and Support Levels
The chart given below elucidates the possible resistance and support levels of Litecoin (LTC) in 2026.
From the above chart, we can analyze and identify the following as resistance and support levels of Litecoin (LTC) for 2026.
| Resistance Level 1 | $122.68 |
| Resistance Level 2 | $182.21 |
| Support Level 1 | $76.11 |
| Support Level 2 | $49.07 |
LTC Resistance & Support Levels
Litecoin (LTC) Price Prediction 2026 — RVOL, MA, and RSI
The technical analysis indicators such as Relative Volume (RVOL), Moving Average (MA), and Relative Strength Index (RSI) of Litecoin (LTC) are shown in the chart below.
From the readings on the chart above, we can make the following inferences regarding the current Litecoin (LTC) market in 2026.
| INDICATOR | PURPOSE | READING | INFERENCE |
| 50-Day Moving Average (50MA) | Nature of the current trend by comparing the average price over 50 days | 50 MA = $80.73Price = $81.18 (50MA < Price) | Bullish/Uptrend |
| Relative Strength Index (RSI) | Magnitude of price change;Analyzing oversold & overbought conditions | 50.03 <30 = Oversold 50-70 = Neutral>70 = Overbought | Neutral |
| Relative Volume (RVOL) | Asset’s trading volume in relation to its recent average volumes | Below cutoff line | Weak volume |
Litecoin (LTC) Price Prediction 2026 — ADX, RVI
In the below chart, we analyze the strength and volatility of Litecoin (LTC) using the following technical analysis indicators — Average Directional Index (ADX) and Relative Volatility Index (RVI).
From the readings on the chart above, we can make the following inferences regarding the price momentum of Litecoin (LTC).
| INDICATOR | PURPOSE | READING | INFERENCE |
| Average Directional Index (ADX) | Strength of the trend momentum | 10.90 | Weak Trend |
| Relative Volatility Index (RVI) | Volatility over a specific period | 56.98 <50 = Low >50 = High | High Volatility |
Comparison of LTC with BTC, ETH
Let us now compare the price movements of Litecoin (LTC) with those of Bitcoin (BTC) and Ethereum (ETH).
From the above chart, we can interpret that the price action of LTC is similar to that of BTC and ETH. That is, when the price of BTC and ETH increases or decreases, the price of LTC also increases or decreases, respectively.
Litecoin (LTC) Price Prediction 2026, 2026 – 2030
With the help of the aforementioned technical analysis indicators and trend patterns, let us predict the price of Litecoin (LTC) in 2026, 2027, 2028, 2029, and 2030.
| Year | Bullish Price | Bearish Price |
| Litecoin (LTC) Price Prediction 2027 | $260 | $40 |
| Litecoin (LTC) Price Prediction 2028 | $300 | $35 |
| Litecoin (LTC) Price Prediction 2029 | $355 | $30 |
| Litecoin (LTC) Price Prediction 2030 | $420 | $25 |
Conclusion
If Litecoin (LTC) establishes itself as a good investment in 2026, this year would be favorable to the cryptocurrency. In conclusion, the bullish Litecoin (LTC) price prediction for 2026 is $182.21. Comparatively, if unfavorable sentiment is triggered, the bearish Litecoin (LTC) price prediction for 2026 is $49.07.
If the market momentum and investors’ sentiment positively elevate, then Litecoin (LTC) might hit $200. Furthermore, with future upgrades and advancements in the Litecoin ecosystem, LTC might surpass its current all-time high (ATH) of $412.96 and mark its new ATH.
FAQ
1. What is Litecoin (LTC)?
Litecoin (LTC) is one of the pioneer cryptocurrencies that was launched in 2011 after Bitcoin. It operates based on the proof-of-work (PoW) consensus model. Litecoin (LTC) is “silver to Bitcoin’s gold”.
2. Where can you purchase Litecoin (LTC)?
Litecoin (LTC) has been listed mostly on all crypto exchanges – from Binance, OKX, Bybit, Cointr Pro, and DigiFinex.
3. Will Litecoin (LTC) reach a new ATH soon?
With the ongoing developments and upgrades within the Litecoin platform, LTC has a high possibility of reaching its ATH soon.
4. What is the current all-time high (ATH) of Litecoin (LTC)?
On May 10, 2021, Litecoin (LTC) reached its new all-time high (ATH) of $412.96.
5. What is the lowest price of Litecoin (LTC)?
According to CoinMarketCap, LTC hit its all-time low (ATL) of $1.1137 on January 14, 2015.
6. Will Litecoin (LTC) reach $200?
If the bullish trend continues and if Litecoin (LTC) retests its resistance levels, it will hit $200 soon.
7. What will be Litecoin (LTC) price by 2027?
Litecoin (LTC) price is expected to reach $260 by 2027.
8. What will be Litecoin (LTC) price by 2028?
Litecoin (LTC) price is expected to reach $300 by 2028.
9. What will be Litecoin (LTC) price by 2029?
Litecoin (LTC) price is expected to reach $355 by 2029.
10. What will be Litecoin (LTC) price by 2030?
Litecoin (LTC) price is expected to reach $420 by 2030.
Top Crypto Predictions
Monero (XMR) Price Prediction
Telcoin (TEL) Price Prediction
Aave (AAVE) Price Prediction
Disclaimer: The opinion expressed in this article is solely the author’s. It does not represent any investment advice. TheNewsCrypto team encourages all to do their own research before investing.
You May Also Like

Stellar (XLM) Eyes $0.28 After Roadmap Signals Stablecoin and Lending Growth
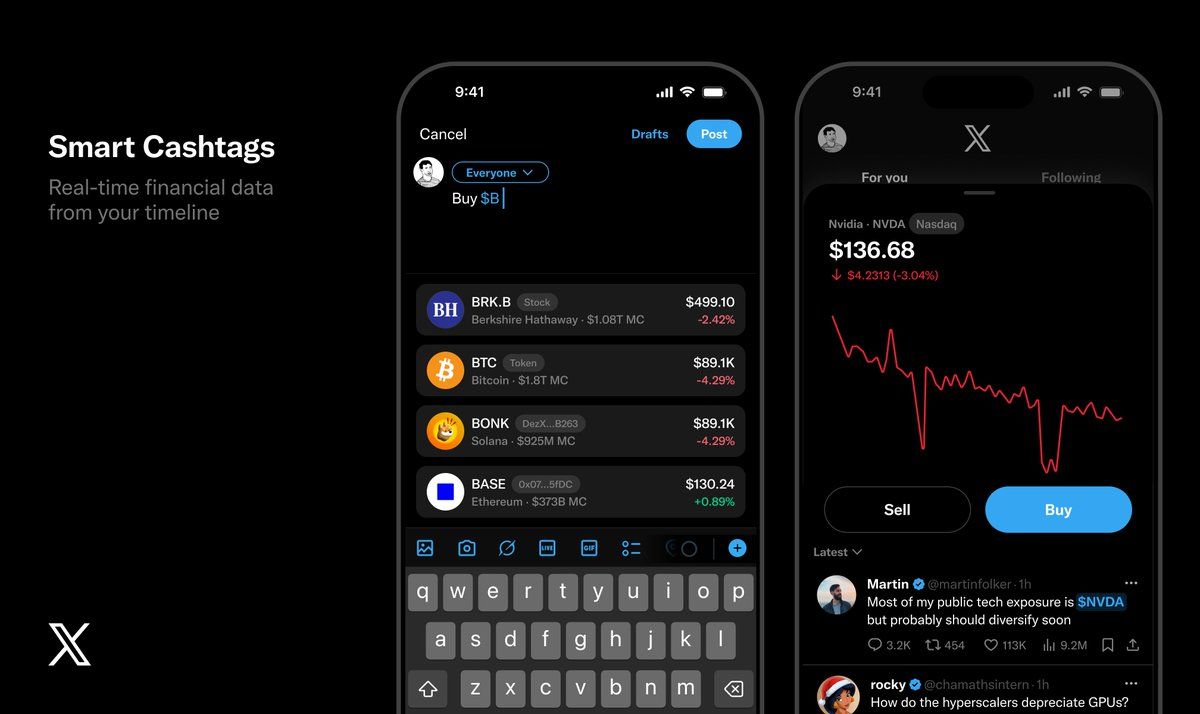
X Smart Cashtags: Elon Musk’s Platform Eyes Crypto and Stock Trading Integration
