XRP Surges Back to $1.39 on Heavy Morning Volume — Momentum Builds for Next Move
In crypto markets, the shape of a recovery matters as much as the recovery itself. On April 29, 2026, XRP delivered one of the most technically significant intraday moves of the month — a sharp V-shaped rebound from overnight lows near $1.365, surging back to $1.39 on noticeably heavy morning volume. This is not a casual bounce. The speed, volume confirmation, and structural context of this move signal that the bulls are not just defending ground — they are actively building the foundation for the next directional leg. The question every XRP trader is now asking is whether $1.39 is a ceiling to break or a floor to hold.
Chart Reading: What the 24-Hour Price Data Tells Us
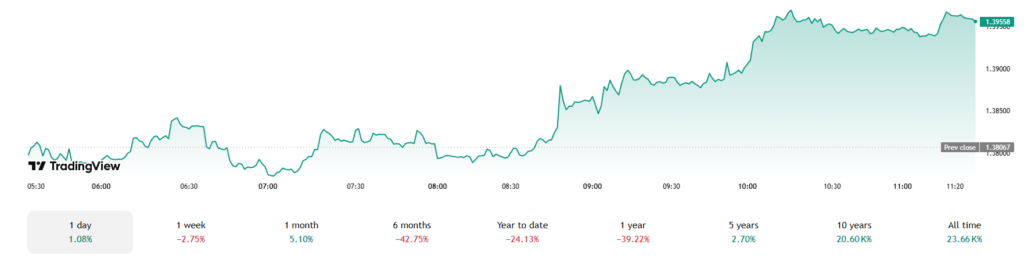
Referencing the April 28–29 hourly chart directly, the price action narrates a clear story. XRP opened the session near $1.39, sold off steadily through the afternoon and evening of April 28, reaching a session low around $1.365 near 9:00 PM. This intraday drop of roughly 1.8% was accompanied by thin volume — a technically important detail that signals the selling was not conviction-driven distribution but rather passive profit-taking and low-liquidity drift.
Then, in the early morning hours of April 29, a sharp reversal emerged. Price recovered the entire overnight loss and reclaimed $1.39 as the volume histogram spiked visibly — a textbook high-volume reclaim pattern. When price recovers lost ground on expanding volume, it confirms that active buyers stepped in with purpose, not simply that sellers disappeared. This asymmetry between low-volume selling and high-volume buying is one of the most reliable short-term bullish signals in technical analysis.
 Source: TradingView
Key Technical Levels: The Battlefield Defined
The nearest resistance for XRP sits at $1.43 — about 2.3% above current price — and a sustained break above this level could open the door toward $1.46, the next resistance zone. On the downside, the first support level is at $1.39, with the next area to watch at $1.36 if that level fails to hold.
This places XRP at a critical inflection point right now. The $1.39 level is simultaneously the current price, a defined support, and the base of the V-shaped recovery. Holding this level on a closing basis is the minimum requirement for bulls to maintain structural credibility.
If bulls hold the $1.38 support and close a daily candle above $1.45, XRP could target $1.60 within the next three to seven days. The $1.38 level aligns with the 38.2% Fibonacci retracement of the recent rally and has served as a demand zone, with buyers stepping in on each dip this week.
Oscillators & Momentum: The Neutral-to-Bullish Shift
The RSI(14) reads 49.63 for XRP — a neutral reading suggesting the market is waiting for a catalyst before committing to direction. On the weekly chart, the RSI is at 37.20, indicating an oversold condition, while the daily exponential moving averages show a bearish signal with XRP trading below all five daily EMAs.
This configuration — oversold on the weekly, neutral on the daily — is a classic pre-breakout compression setup. Oversold weekly RSI historically acts as a coiled spring; the energy is building beneath the surface even if the daily chart looks directionless. The morning volume surge on April 29 may be the first exhale of that coil.
Bullish Catalysts: Fundamentals Supporting the Surge
Cup-and-Handle Formation Spotted: An analyst identified a cup-and-handle formation on April 28, suggesting a 16% upside target if the key resistance level is broken. A 16% move from current levels would place XRP near $1.61 — a target that aligns with multiple independent analyst projections.
ETF Inflows Accelerating: XRP ETFs recorded $55.39 million in inflows over the past week — the strongest performance of 2026 — with U.S.-listed funds seeing four consecutive days of inflows totaling nearly $39 million, lifting total assets under management above $1.25 billion. Institutional money does not flow into a dying asset.
Ichimoku Cloud Breakout Setup: XRP is pressing against the bottom of the weekly Ichimoku cloud, and the last two times it cleared this zone, the XRP price surged from $0.50 to $3.40 in late 2024 and from $2.20 to its $3.65 high in July 2025. A third cloud breakout from this technically identical position would be a historically powerful signal.
XRPL Quantum-Resistance Roadmap: Ripple announced a four-phase plan to make the XRP Ledger quantum-resistant by 2028, with Phase 2 involving vulnerability assessments and testing of post-quantum cryptography algorithms already underway in 2026. Infrastructure investment of this caliber signals long-term institutional confidence in the network.
Bearish Risks: What Could Derail the Move
XRP decisively broke below the $1.40 support level in the prior session, with the move accompanied by a surge in trading volume confirming strong selling pressure and turning that level into new resistance. This breakdown from a triangle pattern shifted the immediate technical outlook to bearish, with analysts watching $1.37 as the next support.
Additionally, the $1.45 resistance level represents a massive supply wall, with approximately 1.24 billion tokens held by investors who purchased between $1.45 and $1.47. This overhead supply means any breakout attempt will face heavy absorption from underwater holders seeking to exit at breakeven.
Technical Summary Scorecard
| Indicator | Reading | Signal |
|---|---|---|
| Current Price | $1.39 | 🟡 At Key Support |
| Daily RSI (14) | 49.63 | 🟡 Neutral |
| Weekly RSI | 37.20 | ✅ Oversold — Bullish |
| Intraday Volume | Heavy Spike | ✅ Bullish |
| ETF Weekly Inflows | $55.39M | ✅ Institutional Demand |
| $1.43 Resistance | 2.3% Above | 🔴 Immediate Hurdle |
| $1.45 Supply Wall | 1.24B Tokens | 🔴 Major Overhead Risk |
| Cup & Handle Pattern | Identified | ✅ 16% Target Possible |
Conclusion: Volume Speaks Louder Than Price
The morning surge back to $1.39 on heavy volume is XRP’s clearest signal in days. Price alone moving up means little — but price recovering on expanding volume, in the context of oversold weekly RSI, a cup-and-handle formation, record ETF inflows, and a historically potent Ichimoku cloud test, tells a structurally bullish story. The bears have one last line of defense at $1.43–$1.45. If the bulls absorb that supply wall with the same conviction shown in today’s morning session, the next target of $1.60–$1.66 becomes a realistic near-term destination. Momentum is building. The next move is approaching fast.


You May Also Like
USD/INR: 95.23 Retest Risk Looms as Societe Generale Flags Intensifying INR Pressure

Stablecoin impasse causing DeFi, ‘ethics’ concerns grow