

Fail $83 and SOL could slide to $80 — Solana price today risk-off setup
As of 27 May 2026, Solana price today sits near $84 amid a risk-off crypto tape. Sellers dominate while Bitcoin strength and Extreme Fear (25) keep alt bids thin.
Solana is hovering around $84 after a heavy week for altcoins. The dominant force is not project-specific; it is macro crypto risk. Meanwhile, Bitcoin dominance sits near 58%, and the fear & greed index is in Extreme Fear (25). In this backdrop, capital prefers safety, starving alts of sustained bids.
This moment matters because SOL is sitting at a decision zone. Hold $83–$84 and a mean-reversion pop toward $86–$88 is possible. However, lose it and the lower Bollinger band near $80 can come into play quickly. With daily ATR around 3.25, the next leg can move several dollars fast.
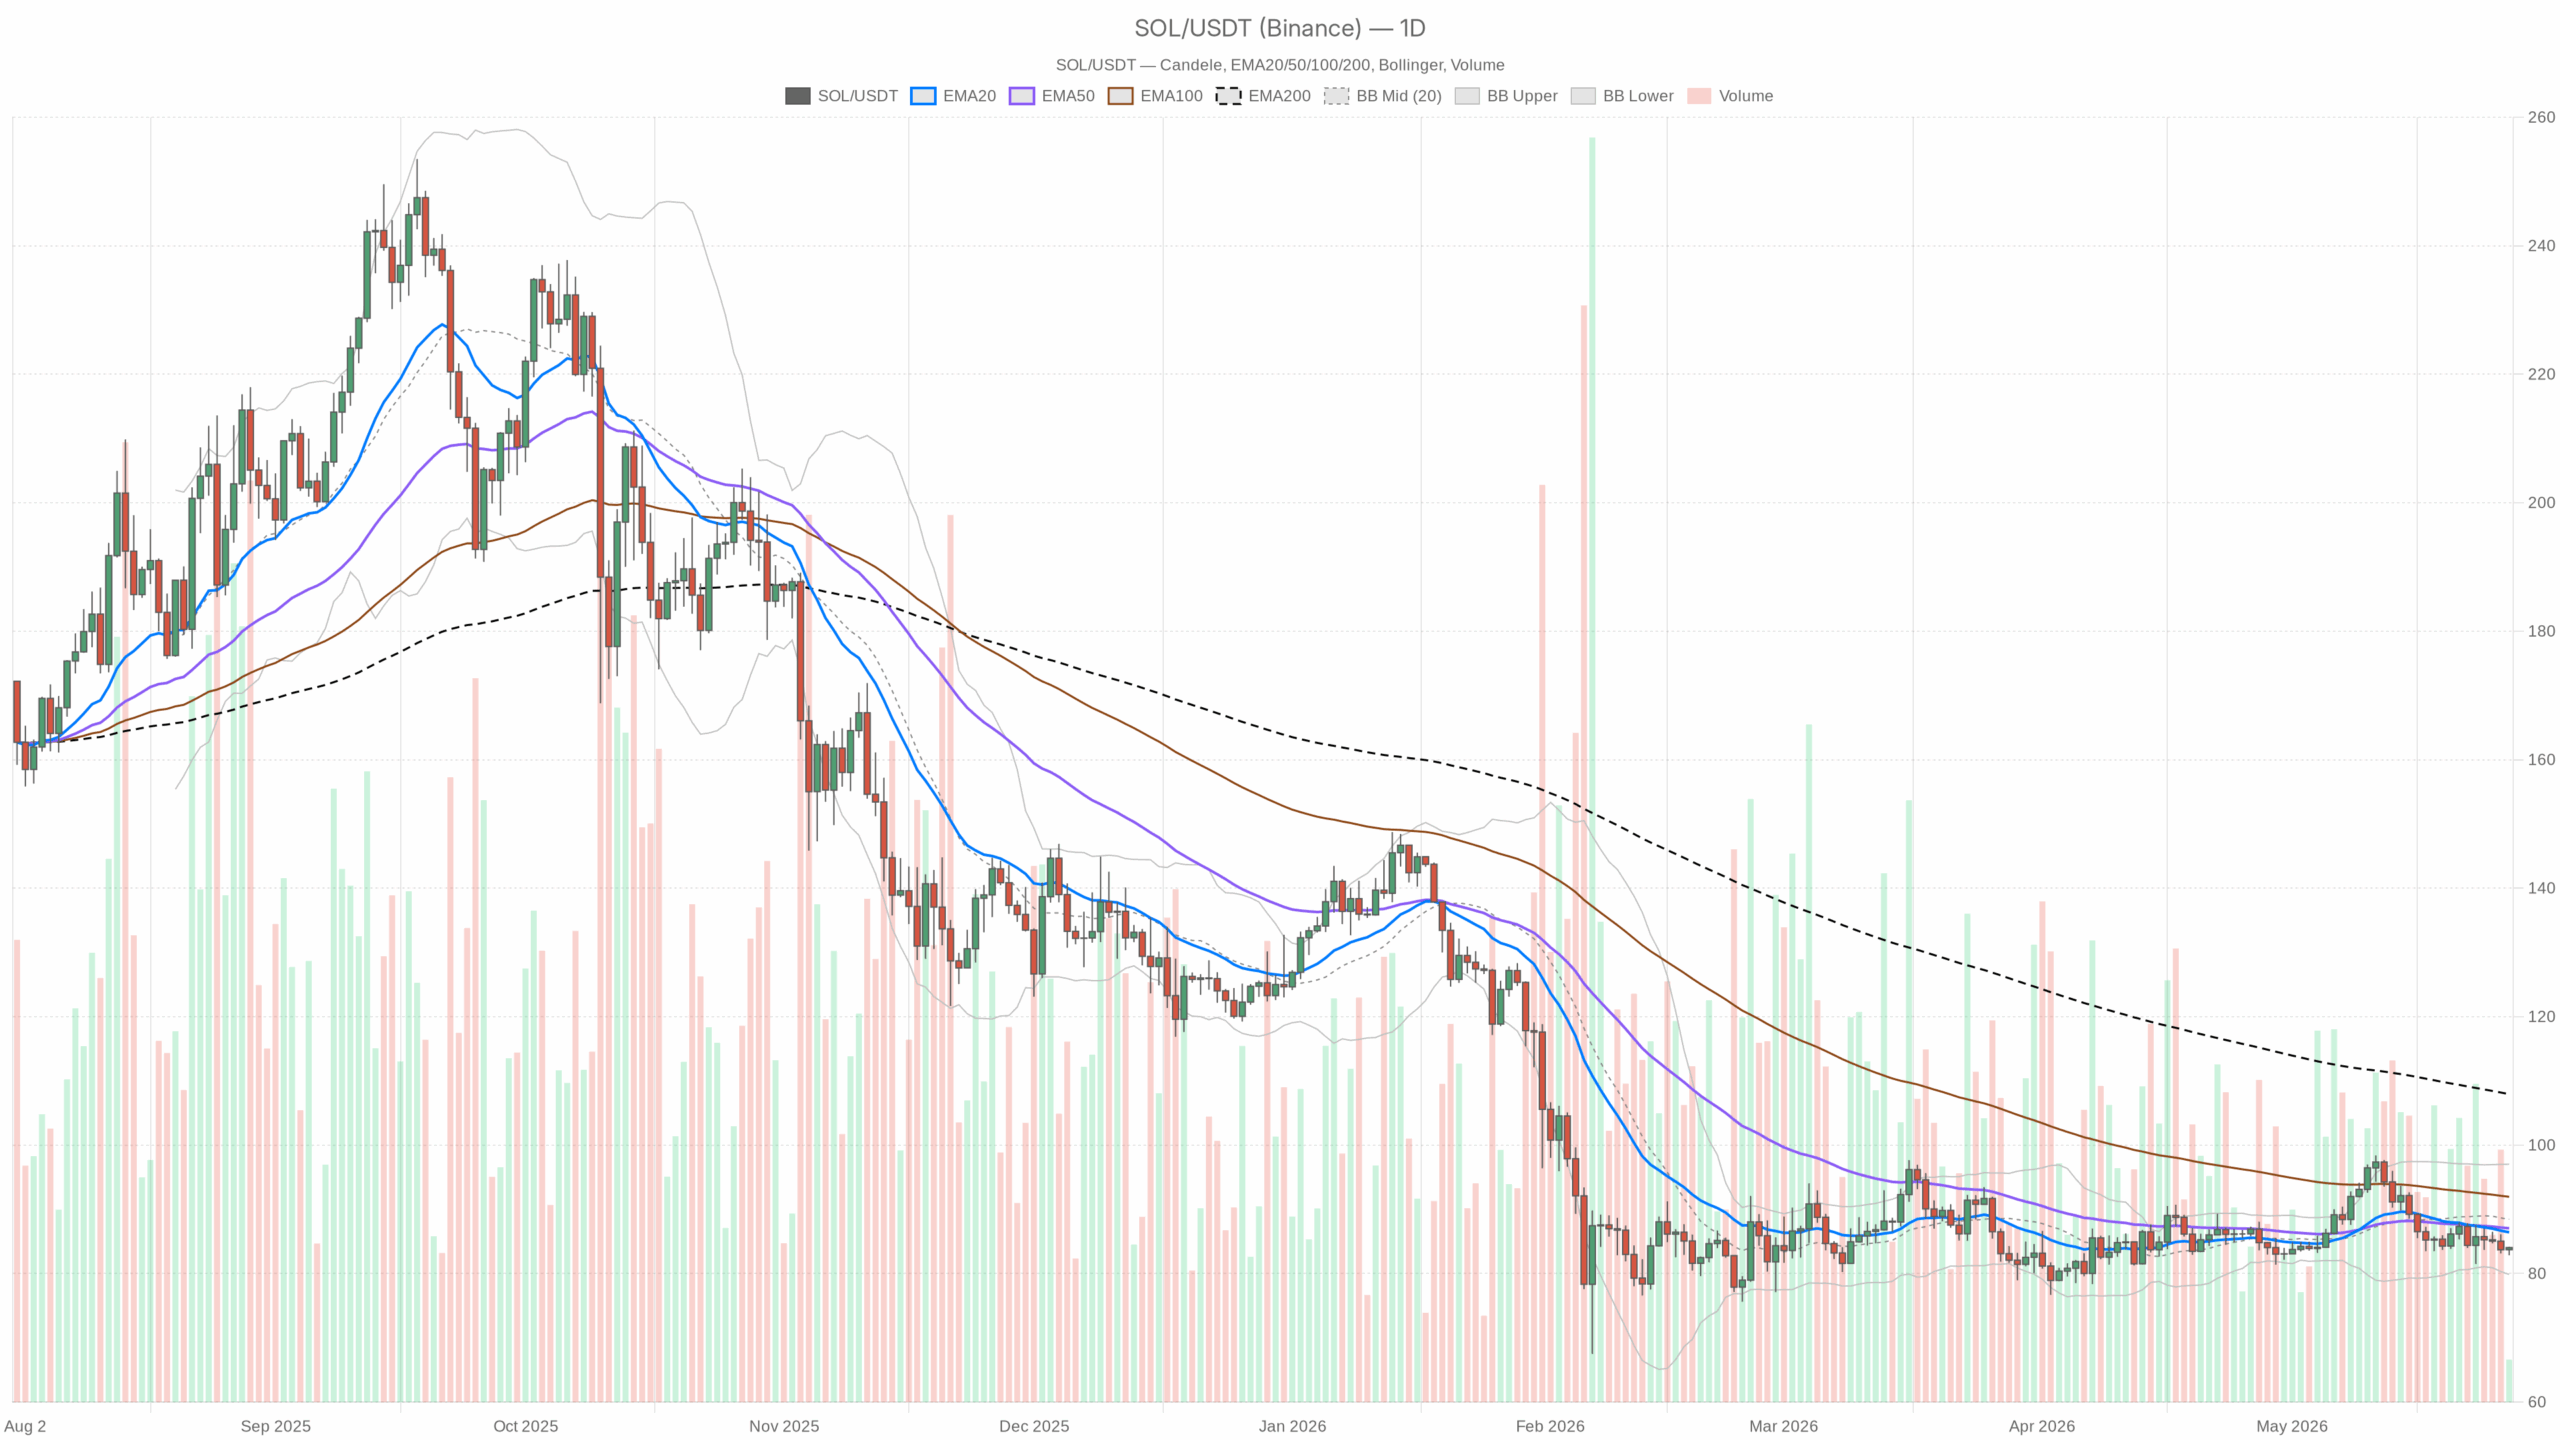 SOL/USDT — daily chart with candlesticks, EMA20/EMA50 and volume.
Market logic
Overall, daily defines the bias: trend pressure is down. Price is below the 20/50-day EMAs, and momentum indicators still lean bearish. That keeps rallies suspect unless they reclaim key moving averages.
Hourly tests the base: the 1H chart is trying to stabilize on its 20-EMA and the daily pivot, but it remains capped by the 50- and 200-EMAs. However, until SOL pushes through $84.6–$85.7, bounces are vulnerable to selling.
15-minute is execution-only: micro momentum is positive, but the 15m 200-EMA near $84.6 is the first ceiling. Even so, a clean push and hold above that level would strengthen any intraday long attempt; failure there keeps the path of least resistance lower.
Indicator evidence (daily unless noted)
- RSI (D1): 42.97 — below 50 and not oversold; sellers still have the edge with room to extend.
- MACD (D1): line -0.88 vs signal -0.29; histogram -0.59 — downside momentum persists; no bullish cross yet.
- EMAs (D1): Close $84.06 vs EMA20 $86.44, EMA50 $87.06, EMA200 $107.95 — trend is down; rallies into $86–$87 likely face supply.
- Bollinger Bands (D1): mid $88.45, upper $97.03, lower $79.87 — trading in the lower half; a break under the $83 area can pull toward $80; reclaiming the mid-band would shift tone constructive.
- ATR14 (D1): 3.25 — average daily swings of ~$3–$4; stops and size should respect that volatility.
- Pivots (D1): PP $83.70, R1 $84.55, S1 $83.22 — price is orbiting PP; above R1 opens a run at $85–$86; below PP risks an S1 test and lower-band drift.
- Intraday markers: 1H close $84.09 with EMA200 at $85.67 and 50-EMA at $84.56; 15m EMA200 near $84.59 — first hurdle is ~$84.6; clearing and holding above sets up a test of $85.7.
Multi-timeframe read
Daily (macro bias)
Bias is bearish. Price sits below the 20/50-day EMAs, RSI is sub-50, and MACD remains negative with a widening histogram. We are in the lower half of the Bollinger envelope. Therefore, structure favors continuation toward the $80 area, or a fade-worthy bounce into $86–$88 that likely stalls unless the 20-day is reclaimed.
1H (confirmation)
The hourly is trying to base around the daily pivot ($83.7), with the MACD histogram slightly positive and RSI near neutral. However, the tape is still below the 50- and 200-hour EMAs ($84.56 / $85.67). That is the tension: early mean-reversion energy against intact overhead resistance. That said, Solana price today hinges on reclaiming $84.6–$85.7; until then, sellers retain leverage.
15m (execution)
Momentum is improving (RSI ~58, MACD green), and price is above the 15m 20/50-EMAs. Even so, the 15m 200-EMA near $84.6 capped the last push. For intraday traders, $84.0–$84.1 is first support, and $84.6 is the first decision point.
Scenarios
Bullish path: Hold above $83.7–$84.0, push through $84.55 (daily R1) and $84.6 (intraday 200-EMA), then reclaim $85.7 (1H 200-EMA). A daily close back above the 20-day EMA (~$86.4) would confirm a mean-reversion leg toward the band mid ($88.5), with stretch targets into $92–$97 if momentum broadens. Invalidation: a clean break below $83.2 (daily S1) or repeated rejections under $84.6 that roll price under the pivot.
Bearish path: Lose $83.2 and then $82.9 (1H lower band vicinity), and momentum should accelerate into $80, with $79.9 (daily lower band) as the first magnet. With ATR at 3.25, overshoots to $76–$77 are plausible on a trend day. Invalidation: a sustained reclaim of $86.4–$86.5 (20-day EMA area) and hourly acceptance above $85.7 would neutralize the immediate downside setup.
Positioning, risk, and uncertainty
This is a defensive tape for altcoins. If you are trading it, treat $83.7–$84.0 as the battleground: above it, you can justify tactical longs into resistance with tight risk; below it, momentum shorts toward $80 make sense as long as the hourly stays capped under $84.6–$85.7. Moreover, size modestly and be ready to switch bias quickly at those inflection levels. In a market led by Bitcoin and marked by fear, conviction should trail price, not lead it.
In sum, bears still have the upper hand while $84 struggles to build a base. A decisive move through $84.6–$85.7 would open room for mean reversion, but losing $83–$84 risks fast tests of $80 and below.


You May Also Like
XRP price could reach $7.5-$8 if on-chain pattern repeats, CryptoSlate analysis suggests

Compass Point Expands its Institutional Sales Team

Crypto exchanges with lowest fees



