1. Today's Market: Oil Cleared $116 and the Dow Fell Hardest
Unit: %, single-day change on October 23; all three readings are negative, so the bars are drawn from zero downward on one shared scale. The Nasdaq reads −0.21%, the S&P 500 −0.52% and the Dow −1.23%.
The three indexes fell together yet finished 1.02 percentage points apart. The cause sat in oil: Brent crude rose 3.1% in a session to clear $116 a barrel, its highest since June 2022. When oil climbs, inflation expectations follow, and rate-sensitive assets are repriced first.
The indexes fell together yet finished 1.02 percentage points apart, and the gap is what each one holds. Among Nasdaq-listed constituents, energy averaged a 3.09% gain that day and technology 0.76%, so both sides were rising and the Nasdaq lost only 0.21%; the Dow carries too little energy to offset the rest of what it holds, and it shed 652.82 points. Days like this are better read with a different question: not how far the market fell, but which index fell hardest. Whichever one leads the fall is holding the assets being repriced that day.
2. Stock in Focus: CrowdStrike +8.25%, With the Whole Security Group Moving
Unit: %. These six stocks are security software companies in the Software - Infrastructure industry, grouped by hand rather than from an automatic peer list; the set spans positive and negative, so a zero line is drawn and all six share one scale. CrowdStrike sits at one end on +8.25% and Gen Digital at the other on −0.04%. This chart compares these six stocks only and is not an industry average.
The move had two layers, one belonging to the group and one to the company. The group layer was the global patch rush set off by a PHP flaw: once the flaw was public, companies moved security budgets forward, and more than one vendor benefits, so Zscaler rose 7.31%, Palo Alto Networks 7.22%, Okta 5.82% and Fortinet 4.05%, while only Gen Digital, which sells consumer security, finished at −0.04% and barely moved. The company layer was the widened NVIDIA partnership: Falcon Guardian now wires AI agent prompts and runtime activity into the Falcon platform, which brings the question of what is acting on your behalf inside the same controls. Volume ran 1.35 times average on turnover of $3.45B, so the move came on volume rather than on a thin tape. ⚠ The work is unfinished: the Falcon Guardian and OpenShell integration is still in progress, and chip-level execution on the BlueField-4 DPU is still at the planning stage.
Five Dimensions: Peer Rank a Full 100, Valuation Heat Weakest at 30
Unit: 0 to 100, against peers and its own one-year history, measured over a one-year window rather than the single session. Peer rank is at the full 100, trend position reads 85, relative strength 82, volatility 72, and the weakest, valuation heat, reads 30.
The shape leans to the upper right with a single notch missing. Peer rank at the maximum, trend position at 85 and relative strength at 82 all say it stands near the front of this group, and volatility at 72 says the position was not bought with violent swings. The one dimension that collapses is valuation heat at 30, which measures how high the industry's current valuation sits against its own history, so a low score means expensive. The reading is this: part of the business advantage is already in the price, and what comes next has to be funded by new results. Four strong dimensions and one weak one, where the weak one is a price condition rather than a flaw, and the two should be read apart.
3. What to Watch Tonight: Three Links of the Chip Chain in the Same Minute
After the close at 20:00|Cadence (CDNS) A top-two chip design software (EDA) vendor, at the head of the chip supply chain
After the close at 20:00|Celestica (CLS) Contract manufacturing for AI servers and networking hardware; the stock closed at $260.01 on October 23, down 3.35%, near its 52-week low of $244.51
After the close at 20:00|Amkor (AMKR) Advanced semiconductor packaging and test; the stock closed at $39.30 on October 23, up 0.64%
No U.S. economic data is due tonight The macro focus this week is the Fed rate decision and press conference on October 28
Two more readings on October 29 Third-quarter GDP and the September PCE price index arrive the same day
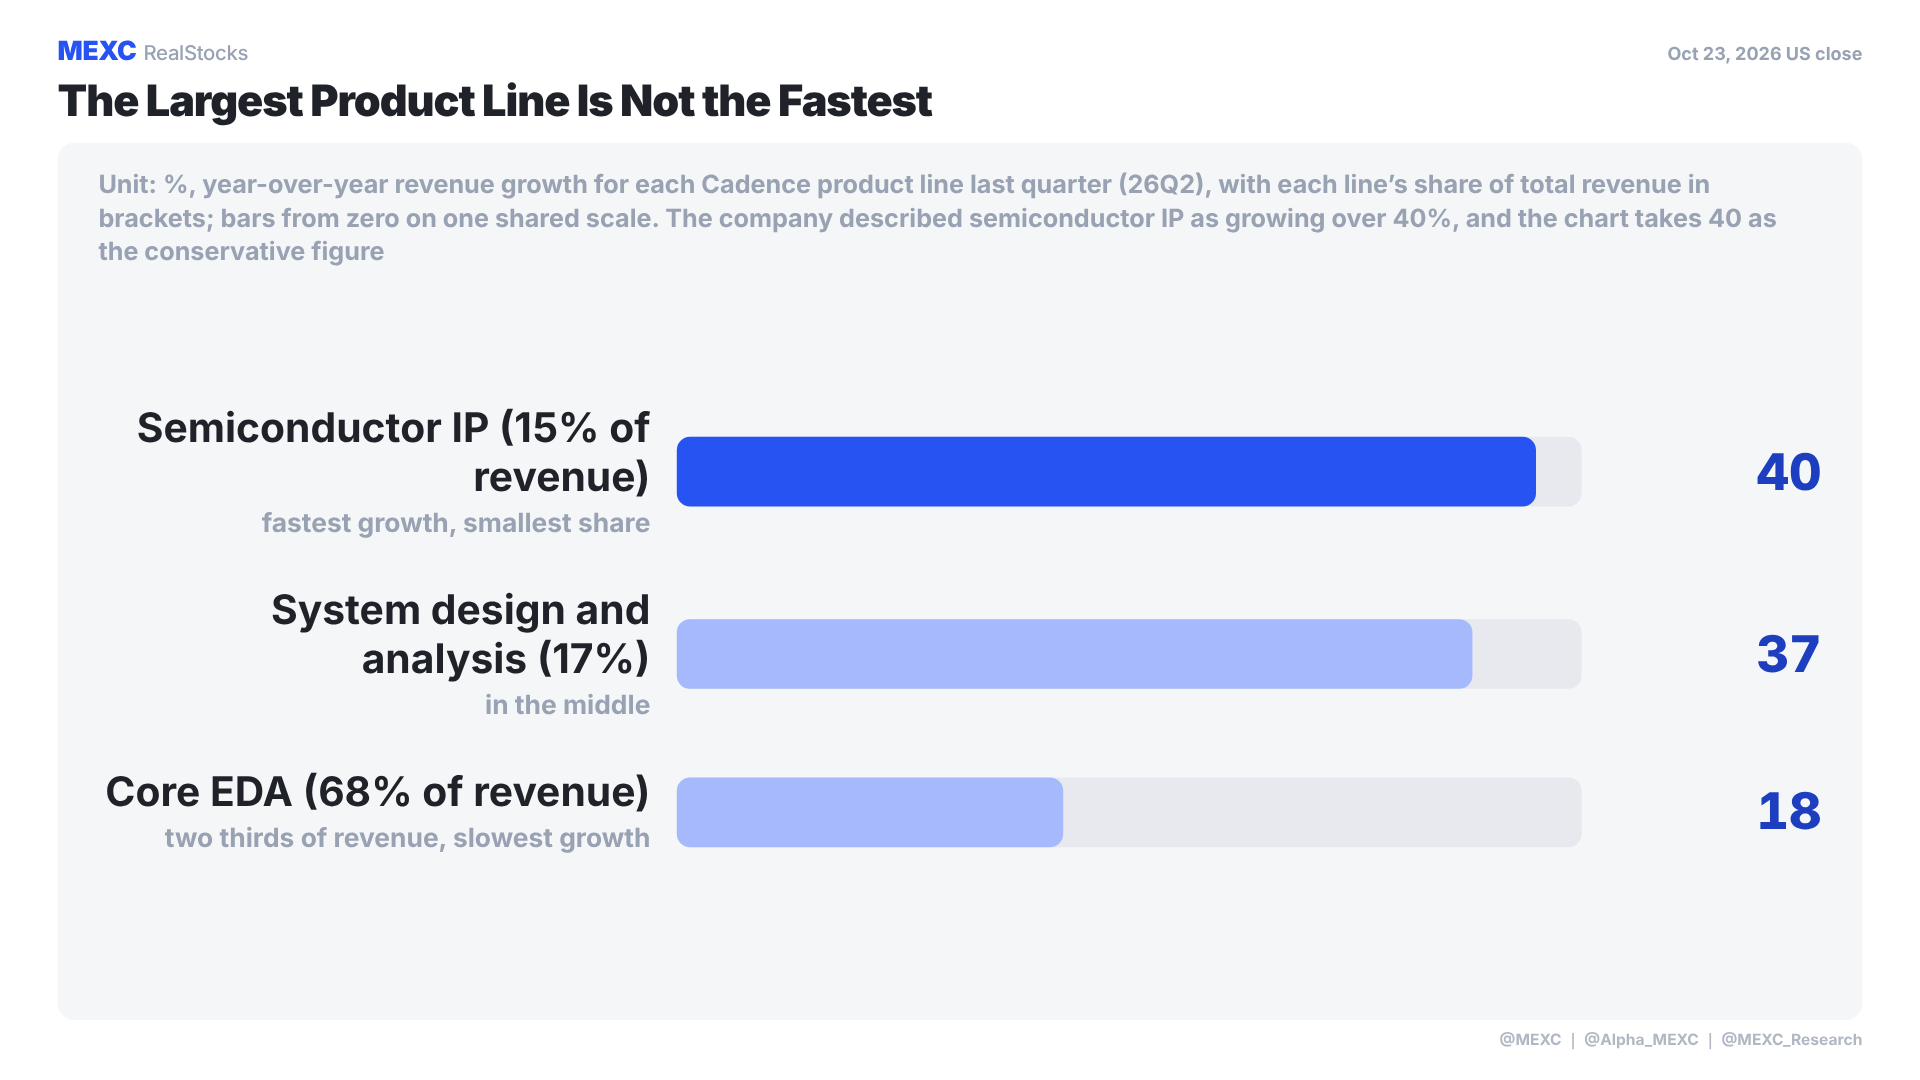
Unit: %, year-over-year revenue growth for each product line last quarter, with each line's share of total revenue in brackets; all three bars are drawn from zero on one shared scale. The company described semiconductor IP as growing over 40%, and the chart takes 40 as the conservative figure; system design and analysis grew 37% and core EDA 18%.
The largest line is not the fastest line Core EDA is 68% of revenue but grew 18%, while semiconductor IP is 15% of revenue and grew over 40%
The gap comes from the revenue model, not from demand Core EDA is a multi-year subscription recognized over the period, so growth is smooth by construction; IP sells ready-made interface blocks straight to chip designers, and the more a customer is racing the clock, the less it wants to build them from scratch
So IP is the line that tracks the AI chip cycle Watch first whether it holds above 40% for a second quarter, then whether the $8.1B backlog keeps climbing
Read the four-quarter revenue series alongside it $1.34B, $1.44B, $1.47B and $1.58B, with last quarter up 24%, the fastest of the four; full-year 2026 guidance was lifted from $5.9B to $6.0B up to $6.26B to $6.34B, a midpoint 19% higher than a year earlier
A quarterly beat and a guidance raise are not the same event The first says last quarter sold well, the second moves next year's expected design volume
4. Frequently Asked Questions
Q: CrowdStrike rose 8.25% that day. Was that its own move?
A: Half of it. Take the stock's daily change, subtract the industry average for the same day, and what is left belongs to the company: 8.25% minus 1.80% leaves an excess of 6.45 points. But the other four stocks in the set cleared the average by 2.2 to 5.5 points, so the session held both a group move and a single-stock move. The comparison here is these six stocks against their industry average, not against the whole market, so the conclusion stops at this: it went furthest within this group.
Q: All three indexes fell, so why did the Nasdaq lose only 0.21% while the Dow lost 1.23%?
A: The difference is in what each index holds. Among Nasdaq-listed constituents, energy averaged a 3.09% gain that day and technology 0.76%, so both sides were holding it up; the Dow carries too little energy to offset the rest of what it holds and shed 652.82 points. The cause was oil: Brent rose 3.1% to clear $116 a barrel, and once inflation expectations move, what gets repriced first is whatever is valued on distant cash flows. Asking which index fell hardest is more useful than asking how far the market fell.
Q: Should tonight's three reports be read separately or together?
A: Together, because each one stands at a different link of the chip chain. Cadence is at the design end: an AI accelerator runs through its kind of toolchain from architecture through verification to tape-out, which lets it see earlier than a foundry whether the next round of chip design volume is expanding or contracting. Celestica is at the build end and Amkor at the packaging end. Three reports in the same minute means three positions on one chain reporting at once, and the readings can be checked against each other. If the design end's backlog is still climbing while the build and packaging ends soften, the stretch in between is worth asking about.
Disclaimer: This article is compiled and written by the MEXC RealStocks team. The data in this article is based on the closing of the US stock market on October 23, 2026. The content is a compilation of public market information, and individual stocks are publicly discussed targets, which do not represent the recommendation or opinion of MEXC and do not constitute any investment advice. More US stock content: @MEXC | @Alpha_MEXC | @MEXC_Research