The crypto market just took a significant hit after US inflation data for September came in above expectations. Bitcoin (BTC) lost the $81,000 level for the first time in weeks, triggering a broad sell-off that spread to altcoins, tech stocks, and even gold. What worries investors is not just the headline CPI print, but the fact that core inflation also beat forecasts, reopening the possibility that the Federal Reserve (Fed) will raise rates again at its late-October meeting.
Key Takeaways
Bitcoin fell below $81,000 after US CPI beat forecasts, fueling renewed inflation fears.
Nearly $950 million in positions were liquidated, mostly longs; altcoins fell harder.
The odds of a Fed rate hike jumped, pushing US Treasury yields higher.
$80,000 is a critical support level; a break below could send BTC toward $75,000.
Watch ETF flows, upcoming PPI and PCE data, and the FOMC meeting.
1. Crypto Market Slides Across the Board After the CPI Report
Before the inflation data dropped, Bitcoin had been consolidating in a relatively stable range. According to MEXC data,
BTC was trading around $83,800 before sliding to $82,800 within the first few minutes of the CPI release. Selling pressure continued from there, and at the time of writing, the price has slipped below $81,000.
Altcoins took heavier damage. ETH dropped to the $2,370-$2,440 range depending on the time of day, losing more than 5.5% over 24 hours. SOL and XRP shed roughly 4-6%, while many small-cap altcoins tumbled 8-12%. Total crypto market capitalization fell about 2.7% to $2.84 trillion.
The derivatives market amplified the decline. According to CoinGlass, total liquidations over 24 hours reached nearly $950 million, the majority from long positions. Bitcoin and Ethereum led the liquidation charts, each seeing hundreds of millions of dollars in positions forcibly closed. This suggests many traders had bet on a "soft" CPI print and opened highly leveraged positions ahead of the release.
The sell-off also spilled into traditional markets. The S&P 500 fell about 0.6%, the Nasdaq lost 0.8%, and gold briefly dipped to $4,079 per ounce. In the bond market, the 2-year US Treasury yield climbed about 10 basis points to nearly 4.9%, while the 10-year approached 5.3%, its highest level in years. With risk-free yields at these levels, the opportunity cost of holding non-yielding assets like Bitcoin rises sharply.
Notably, this drop comes after a fairly impressive recovery. Bitcoin spent most of the past month consolidating between $80,000 and $87,000 after rebounding from its summer low near $58,000, but it failed to hold firmly above the mid-$80,000s. BTC closed September at $83,556, up 6.36%, following a 25.05% gain in August. Losing $81,000 therefore carries real technical weight: price is now sitting near the bottom of a range that has held for more than a month.
2. Breaking Down September CPI: Energy Leads, Core Inflation Starts to Spread
According to the US Bureau of Labor Statistics (BLS), September CPI rose 0.6% month-over-month and 3.7% year-over-year, up from 3.4% in August and slightly above the 3.6% analyst consensus.
Energy was the main driver. Gasoline prices surged 9.1% in a single month, accounting for more than half of the headline CPI increase. The broader energy index rose 5.2%, as tensions in the Middle East disrupted supply and kept oil above $90 per barrel for most of the past two months. High fuel prices don't just raise transportation costs directly; they also feed, with a lag, into shipping, manufacturing, and retail prices across a wide range of goods.
However, the part that triggered the strongest market reaction was core inflation. Core CPI, which strips out food and energy, rose 2.6% year-over-year and 0.3% month-over-month, both above forecasts of 2.5% and 0.2% respectively. Digging deeper, shelter costs rose 0.4% and airfares jumped 1.2% for the month. Airfares are directly tied to fuel costs, showing that the energy shock has started bleeding into services, exactly the scenario the Fed fears most.
Why would a gap of just 0.1 percentage point cause such a big move? The answer lies in how the Fed reads the data. Inflation driven by energy prices is usually treated as a temporary supply shock that central banks can "look through." But when core inflation accelerates, it signals that price pressure is spreading across the broader economy and risks becoming anchored in consumer expectations. A 0.3% monthly core CPI reading, if sustained, translates to annualized core inflation of roughly 3.6%, well above the Fed's 2% target.
3. Will the Fed Hike in October or Wait Until December?
To understand the market's reaction, it helps to revisit the policy backdrop. The Fed held its target range at 3.50-3.75% at every meeting in 2026 before September. At the September meeting, the Fed raised rates for the first time in three years, lifting the range to 3.75-4.00%. That marked a major turning point, since for months the market had expected the easing cycle to continue.
Expectations for the October meeting have swung wildly over the past few weeks. Early in the month,
CME FedWatch showed only about a 17% chance of another 25-basis-point hike, down from nearly 36% a week earlier, while on prediction market Kalshi, the odds fell to 18% from nearly 70% after a weaker-than-expected September jobs report. Even so, FedWatch still priced in more than a 75% chance of a hike in December.
The CPI report reversed that trend. According to FedWatch data after the release, the probability of an October hike jumped from around 20-22% to the 31-36% range, depending on the time of the update. Investing.com's tracker, based on 30-day Fed Funds futures pricing, showed the probability of a 4.00-4.25% range rising to 35.6% from 20.7% in the previous session. Some sources recorded even higher readings during the most volatile moments of the session. Whatever the exact number, a hold remains the base case, but the margin of safety has narrowed considerably.
Within the Fed, the hawkish camp is also gaining ground. Dallas Fed President Lorie Logan said in early October that hikes of 50 basis points or more may be needed to rein in inflation. Her remarks show that at least part of the Federal Open Market Committee (FOMC) is willing to tighten more aggressively than the market expects.
On the other side, Theresa Sheehan, an economist at Econoday, believes the Fed will likely hold rates in October to buy more time to assess the data before considering a hike in December. Her argument rests on the cooling labor market: hiking while employment weakens could tip the economy into recession, a risk the Fed is unlikely to take on the back of a single month of hot inflation data.
For crypto investors, what matters is not whether the Fed hikes in October, but the overall rate trajectory. A prolonged tightening cycle means a stronger US dollar, persistently high bond yields, and tighter global liquidity, all three of which are headwinds for risk assets.
4. Institutional Flows: ETFs in a Tug-of-War, Derivatives Deleveraging
Flows into US spot
Bitcoin ETFs are a key gauge of institutional sentiment. October so far has been a tug-of-war. Bitcoin ETF flows have been erratic throughout the month, with heavy outflows such as $487.1 million on October 7 and $244.1 million on October 8. On October 13, just before the CPI report, spot Bitcoin ETFs pulled in $175.62 million in net inflows, their best session of the month. Still, for the month as a whole, these funds have recorded net outflows of about $278 million, with total assets standing at $106.98 billion.
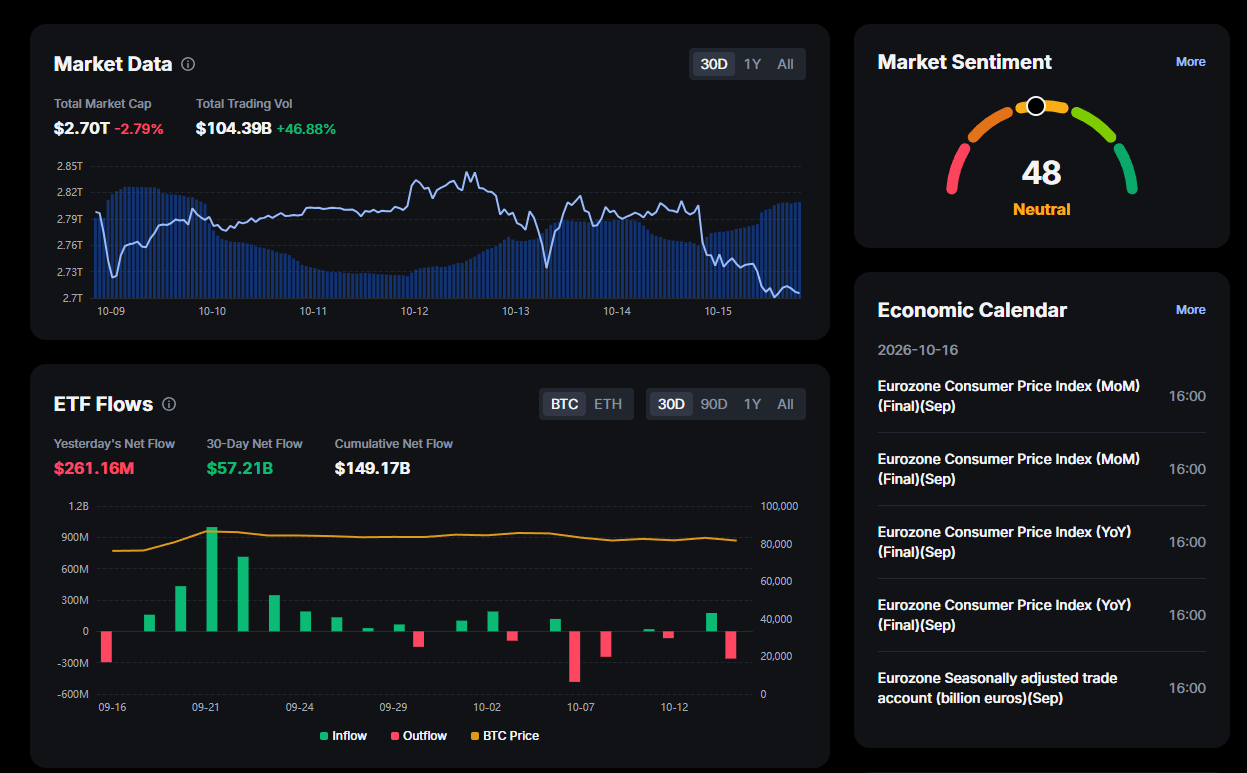
The bigger picture shows institutional capital has not abandoned Bitcoin. Bitcoin ETFs logged net inflows of roughly $2.6 billion in September and $3.5 billion in August, following heavy outflows in May and June. One notable detail: Bitcoin ETFs have seen net outflows on 48% of trading days in 2026, yet remain net positive overall. In other words, a handful of outflow sessions isn't enough to call a trend reversal; what matters is whether the outflow streak extends after CPI.
For Ethereum, ETF flows remain positive. On October 13, spot Ethereum ETFs attracted $24.84 million, while Solana funds saw $1.04 million in outflows. This is one of the reasons analysts are maintaining a constructive medium-term view on ETH.
5. Price Scenarios for Bitcoin, Ethereum, and Solana
Bitcoin: $80,000 Is the Line in the Sand
According to Paul Howard, Senior Director at trading firm Wincent, Bitcoin may continue ranging between $80,000 and $88,000 in the short term. If the $80,000 support gives way, BTC risks a sharp correction toward $75,000. He argues that hotter-than-expected inflation is undermining hopes for looser monetary conditions, which have been the main catalyst for capital returning to risk assets.
This view aligns with pre-CPI commentary from many analysts. Lacie Zhang, an analyst at Bitget Wallet, warned that an upside surprise could trigger a sharper repricing and identified $81,000-$82,000 as the next major support zone. That zone has now been tested and temporarily broken, making the psychological $80,000 level the last line of defense for the consolidation range.
On the flip side, Matt Mena, Senior Crypto Research Strategist at 21Shares, believes the market may have already priced in most of the risk last week, when Bitcoin left $85,000 and pulled back to test the $81,000-$82,000 zone. If uncertainty around monetary policy gradually clears, BTC could still reclaim $85,000 and push toward $90,000. The nearest resistance to watch is the September high of $87,397, set on September 21.
Ethereum and Solana: Upside Hinges on ETF Flows
Matt Mena also remains bullish on Ethereum and Solana, citing inflows into crypto ETFs. He expects ETH to consolidate around $2,500 before heading toward $2,800-$3,000, while SOL could climb to $130 by the end of the quarter.
That said, ETH has already fallen below $2,500, which means this level has flipped from support to short-term resistance. With a higher beta than Bitcoin, ETH and SOL typically fall harder in macro-driven sell-offs but also rebound more strongly when sentiment improves. Traders should watch whether ETH can reclaim $2,500 before confirming the consolidation scenario laid out by 21Shares.
6. Upcoming Economic Calendar and Trading Strategy
The recovery scenarios above still depend heavily on upcoming macro data. Here are the key dates:
September Producer Price Index (PPI): released October 15 at 8:30 AM ET (12:30 UTC). PPI reflects business input costs and is often a leading indicator for CPI. A hot PPI print would strengthen the case for an October hike.
September PCE data: the Fed's preferred inflation gauge and the final piece of the puzzle before the FOMC meeting.
FOMC meeting, October 27-28: the rate decision and the Fed Chair's press conference will shape expectations for flows into risk assets for the rest of the year.
Oil prices and Middle East developments: since energy is the main driver of inflation, any sign of easing geopolitical tension could relieve pressure on the Fed.
For traders, a few risk management principles are worth considering right now:
Cut leverage around data releases. Nearly $950 million in liquidations is a reminder that betting on macro data outcomes with high leverage is extremely risky. Volatility in the first few minutes after a release is often enough to sweep both sides.
Watch the reaction at $80,000. A break on heavy volume with a daily close below this level would open the door to $75,000. Conversely, a quick bounce backed by spot buying could signal that the market has absorbed the bad news.
Track ETF flows in the coming sessions. If institutional money keeps flowing in despite falling prices, it's a sign long-term investors are using the pullback to accumulate.
Keep an eye on funding rates and Open Interest. Persistently negative funding while price holds support often sets the stage for a short squeeze, while OI rising sharply into a decline suggests sellers are in control.
Conclusion
Bitcoin's recent drop is a direct reaction to the risk of tighter-than-expected monetary policy. September CPI wasn't just hot on energy; it also showed price pressure spreading into shelter and services, forcing the market to reprice the odds of an October Fed hike. Meanwhile, ETF flows are caught in a tug-of-war, and leverage in the derivatives market has just gone through a major flush.
Still, the picture isn't entirely bearish. Bitcoin remains within a consolidation range that has held for over a month, institutional inflows in Q3 were solid, and some analysts believe most of the risk is already priced in. Over the next two weeks, PPI, PCE, and above all the October 27-28 FOMC meeting will determine whether Bitcoin successfully defends $80,000 and heads back to the $85,000-$90,000 range, or enters a deeper correction.
Disclaimer: This content is provided for informational and educational purposes only and does not constitute investment, financial, legal, or tax advice. The cryptocurrency market is highly volatile. Always conduct your own research and only invest capital you can afford to lose.